information analyst
43.8K views | +0 today
Follow
information analyst
km, ged / edms, workflow, collaboratif
Your new post is loading...
Rescooped by michel verstrepen from visualizing social media
Scoop.it!

Infographic: What Drives Social Media Searches and Engagement?

Infographic: What Drives Social Media Searches and Engagement? | information analyst | Scoop.it

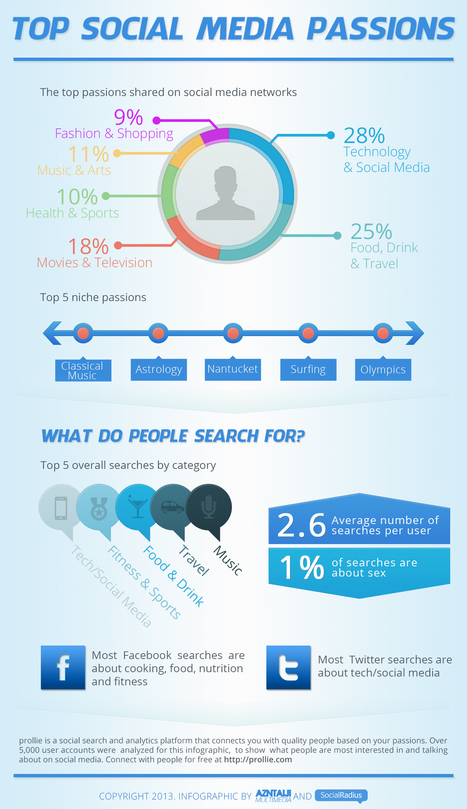
As it turns out, social media and search go hand-in-hand...


From Facebook and Twitter, to Pinterest and MySpace (yes, it still exists), social media users are often on the search for… something.

For marketers, understanding the searches that lead to improved engagement is critical.

To that end, Azntaiji Multimedia and SocialRadius have produced a new infographic highlighting exactly what so many of us are searching for.


Via Lauren Moss
Joe Wise's curator insight, May 21, 2013 5:33 PM

Helpful in knowing which clients will need you to pull content out of thin air for them >

Ramzi Mouakassa's curator insight, May 22, 2013 7:06 AM

Not a surprise at all that the top 5 searched topics socially are (1) Technology / Scoial Media, (2) Fitness, Health, & Sports, (3) Music, (4) F&B, & (5) Travel... I think that this one dropped Movies / Cinema for sure

Michelle Gilstrap's curator insight, May 22, 2013 12:37 PM

Ever wonder what people are searching for? This infographic will open your eyes. If you have a small business, you might want to be on the social media that can get this type of search by consumers.

Rescooped by michel verstrepen from visual data
Scoop.it!

Interaction Design for Data Visualizations

Interaction Design for Data Visualizations | information analyst | Scoop.it
Interactive data visualizations are an exciting way to engage and inform large audiences. They enable users to focus on interesting parts and details, to customize the content and even the graphical form, and to explore large amounts of data. At their best, they facilitate a playful experience that is way more engaging than static infographics or videos.

Several ideas and concepts of interaction design for data visualizations are presented in this post, using 11 examples from the web. The overall concepts featured include:

The Basics: Highlighting and Details on Demand Making More Data Accessible: User-driven Content Selection Showing Data in Different Ways: Multiple Coordinated Visualizations Showing Data in Different Ways: User-driven Visual Mapping Changes Integrating Users’ Viewpoints and Opinions

Visit the complete article for numerous links, useful visuals and specific details on how to understand, implement and evaluate interactive design elements used in data visualization design.


Via Lauren Moss
Hans's comment, October 2, 2012 5:09 AM
Great article, I really like the idea of interactive information with details on demand. As an interaction designer I always try to balance content management and usability. Here are some interesting examples that made me consider a complete information surface vs a deep level on demand architecture.
JongWon Kim's comment, October 9, 2012 10:39 PM
really beautiful!!
Rescooped by michel verstrepen from XPERTEAM
Scoop.it!

Les techniques secrètes de l’engagement sur internet - La psyché du web social

Les techniques secrètes de l’engagement sur internet - La psyché du web social | information analyst | Scoop.it
Cet article vise à expliciter des astuces permettant d’alpaguer les internautes et de provoquer en eux une réaction que vous souhaitez : l’engagement. Comment ? En instaurant un effet domino inconscient.

Via Pascal STIEVENARD
No comment yet.
Rescooped by michel verstrepen from Time to Learn
Scoop.it!

[Infographie] Les 7 étapes de l’Engagement Digital

[Infographie] Les 7 étapes de l’Engagement Digital | information analyst | Scoop.it

Le schéma suivant, que j’ai réalisé avec notre DA (Fabien Degezelle) dans le cadre d’une présentation, vous propose les différents degrés d’implication de l’utilisateur constatés sur les nouveaux médias… et donc résultants d’une stratégie d’Engagement. En complément, vous retrouvez un rappel visualisé de la règle communautaire des 1%.


Via Frédéric DEBAILLEUL
TAPATONMAC's comment August 28, 2011 3:05 PM
Merci, je garde !