


"Learning Analytics is the measurement, collection, analysis and reporting of data about learners and their contexts, for purposes of understanding and optimizing learning and the environments in which it occurs."
Get Started for FREE
Sign up with Facebook Sign up with X
I don't have a Facebook or a X account


 Your new post is loading...
 Your new post is loading...
Your new post is loading...
"Learning Analytics is the measurement, collection, analysis and reporting of data about learners and their contexts, for purposes of understanding and optimizing learning and the environments in which it occurs."
Beth Dichter's insight:
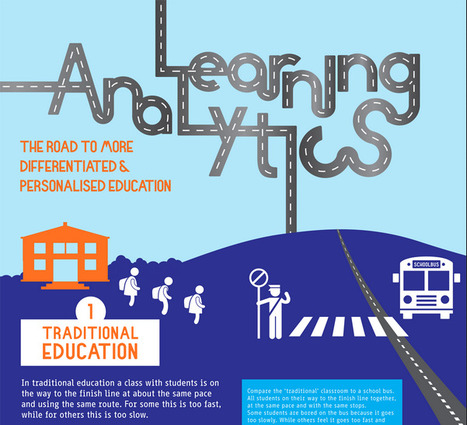
This detailed infographic provides an in-depth look at learning analytics. It begins by describing traditional education as a school bus, with the expectation that all students will get to "the finish line together." The infographic then turns to personalized learning, where students would work at their pace and in their way to master material. Analytics play a key role in personalized education. Why? If you use a tool that provides you with the ability to measure, collect, analyze and report data about your students you have the opportunity to adapt curriculum. The infographic shares seven areas that may be considered. From here the infographic moves to the learning analytics cycle which moves to four areas: * Descriptive - What has happened? * Diagnostic - Why has it happened? * Predictive - What will happen? * Prescriptive - What should I do? What comes next? The role of the teacher, which is followed by a What's Next section. There is much to learn about learning analytics in this infographic. You may download the complete infographic from the site. 
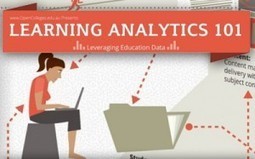
Today we are pushed to determine what is working in education? Data is being collected and in the U.S. teacher evaluations will involve the use of data from a variety of sources. This infographic, Learning Analytics 101, presents a visual representation of what it means to leverage education data looking at issues such as: * What can data do? * When can it be used? * What is "effective learning"? * What are the limitations and costs? * How will it affect the future? If you are trying to wrap your head around learning analytics check out this inforgraphic.
|
How do we prepare out students for Web 3.0 learning? This slide show by Judy O'Connell provides us an opportunity to look back in time, from what we might refer to as Web 0 and the journey to where we are today and where we are heading. Many define Web 2.0 as the social web. Web 3.0 will be defined by data, and the ability to link data in new ways. Many excellent resources are embedded within this slide show, so find some time to pull up your chair and learn more about what the future may hold.
|


Interesante infografia de google analytics
Muita expectativa mas ainda poucos resultados concretos ... De qualquer modo, esta se formando uma percepção de que o modelo educacional vai ser fortemente impactado nos próximos anos