Rennes Métropole- Visualisation de données...
Get Started for FREE
Sign up with Facebook Sign up with X
I don't have a Facebook or a X account


 Your new post is loading...
 Your new post is loading...
Your new post is loading...
Rennes Métropole- Visualisation de données... 
No comment yet.
Sign up to comment

Find the most relevant Twitter hashtags for a given topic using a visual exploration free tool...
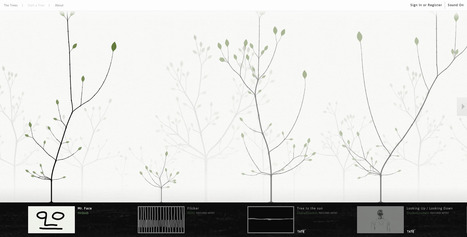
C’est l’histoire d’un géant de l’Internet qui aime la culture (Google Art Project, Versailles 3D …) et d’une institution culturelle de stature internationale qui aime le numérique (live-tweets d’événements, ressources en ligne, expos virtuelles comme la Gallery of Lost Art). La collaboration entre la Tate et Google devait se faire sur Internet, avec comme complices Chris Milk (réalisateur des clips du rappeur américain Kanye West et du duo electro The Chemical Brothers) et Aaron Koblin, petit génie de l’art numérique aux créations loufoques (clip interactif avec animations 3D pour le groupe Radiohead, « marchés aux moutons » en ligne…). De ce partenariat est né le projet Exquisite Forest : une plateforme de création, de partage et d’exposition en ligne, ouverte aux internautes. Via Karen Bastien

L'application TweetingEarth nous permet de visualiser la propagation des tweets d'une recherche en fonction des différents fuseaux horaires.
The Visible Universe, Then and Now Before the telescope was invented in 1608, our picture of the universe consisted of six planets, our moon, the sun and any stars we could see in the Milky Way galaxy.
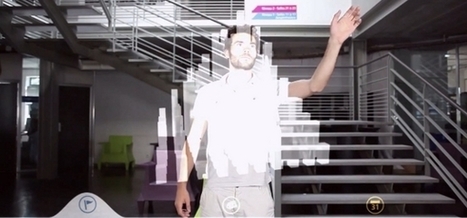
L’exposition Design Meta Data au Centre Pompidou présente des travaux conjoints entre jeunes designers et apprentis ingénieurs.
!["La dataviz de la dataviz" [WeDoData] | Cabinet de curiosités numériques | Scoop.it](https://img.scoop.it/AWs3lpHoho-KHr7BZL-7jDl72eJkfbmt4t8yenImKBVvK0kTmF0xjctABnaLJIm9)
From
zoom

"La dataviz de la dataviz" : une réalisation originale sur les coulisses de la production d'une datavisualisation, depuis la recherche de données jusqu'à son incarnation graphique et interactive. Via Karen Bastien
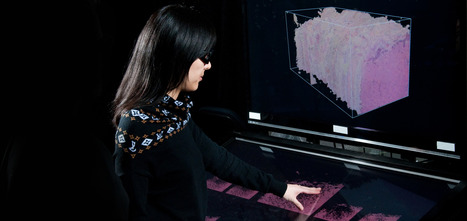
The Electronic Visualization Laboratory (EVL) is an interdisciplinary graduate research laboratory that combines art and computer science, specializing in advanced visualization and networking technologies.

Youth in underserved communities often live in unmapped areas where little is known about the actual geography of services and interactions that shape their daily lives. The Mobile Experience Lab is working on technologies that help youth create and distribute compelling maps of their communities to inform policy and decision making. Working with Unicef and building on the lab’s locative media platform Locast, the Mobile Experience Lab created a digital mapping platform using mobile and web applications that enables youth to report on and map their communities.

For those, who is interested in process of infographics creation, we put below all stages of calendar creation. We were trying different ways to show timeline together with geographical location of the conference. Via Karen Bastien
|

In the framework of our researches, we are focusing on twitter visualization. This social platform indeed offers several opportunities for data visualization: social ties analysis, links between geography and themes/languages, real-time visualization of a particular topic (like a conference), or again to analyse a past topic and its “storyfication”. We spent last week recognizing recent developments related to the topic, identifying three main fields: Real-time visualizations: visualizing twitter stream in realtime during conferences or big events.Visual search: online tools that create a dynamic visual output for a twitter search.Storytelling: the use of visualization to tell an event in the past. There are both interactive and static examples. We’d like to share with you a selection of these examples. Selected artworks have been created in the last three years.

Twicklish est un outil gratuit ayant pour but de vous faciliter l’exploration des tweets de votre compte Twitter. Via Frédéric DEBAILLEUL

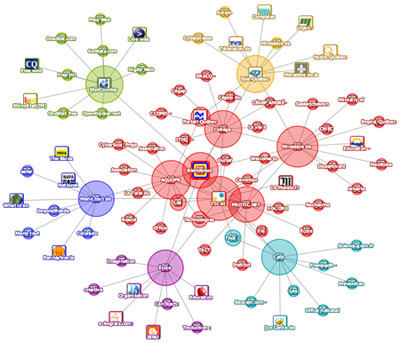
Facebook.com, Google.com, Youtube.com, etc. des sites Internet qui occupent une place de maître dans l'univers du web, sans pour autant occulter les milliers de sites qui rayonnent à leurs côtés. Voyagez de l'un à l'autre grâce à une carte interactive semblable à celle d'une galaxie !
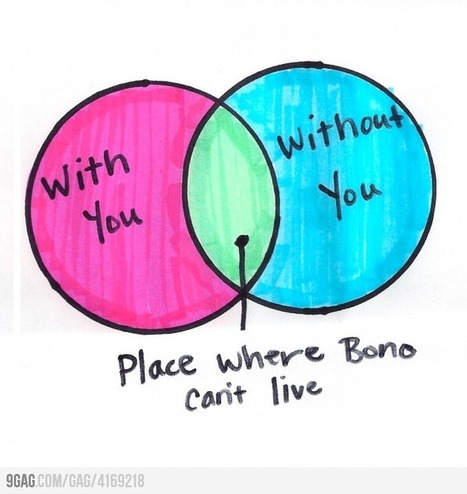
Les paroles des chansons en #dataviz.Envoyez-moi vos #dalalalataviz sur Twitter : @thepixelhunt...
The Ushahidi Platform allows anyone to gather distributed data via SMS, email or web and visualize it on a map or timeline. Our goal is to create the simplest way of aggregating information from the public for use in crisis response. Mission We build tools for democratizing information, increasing transparency and lowering the barriers for individuals to share their stories.
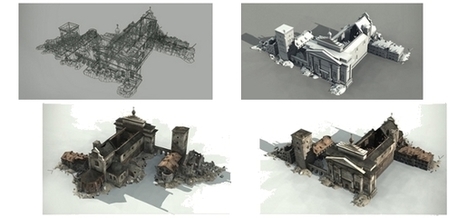
Revivre Varsovie en 1944, parcourir l'Europe comme au temps des Romains : autant de rêves d'amateur d'Histoire qui peuvent devenir réalité grâce au numérique. La preuve en images.
Le projet Terra Dynamica fait référence à l’animation dynamique de la ville, avec pour objectif de modéliser « la vie dans la ville » : ses habitants et ses foules, ses véhicules et sa circulation.
From
expoviz
WeDoData est fier de collaborer à ExpoViz, première exposition française sur la datavisualisation, dans le cadre de Futur-en-Seine. Initiée par La Fonderie, agence numérique d'Ile-de-France, ExpoViz présentera en exclusivité 40 parmi les meilleures datavisualisations mondiales, ainsi qu'une série d'applications interactives. Via Karen Bastien

From
hint
An invisible, ancient source of energy surrounds us—energy that powered the first explorations of the world, and that may be a key to the future. This map shows you the delicate tracery of wind flowing over the US right now.
|